


The Cost of Dying
Okay the title is pretty ominous but I promise this is about Counter Strike and not some existentialism ramble session. I’m hardly qualified enough to talk about CS as it is, let alone philosophy.

When it comes to playing Counter Strike, the value of your plays is a mystery. Not even delving into the many nuances of the word itself, it’s not very clear what value even *is* in Counter Strike.
You might be tempted to look at the in-game economy, as the words “value” and “economy” go hand in hand, and you would be completely justified in saying that. However, while observing the economy in real time isn’t so difficult, beginning to think about quantifying how “value” works in the context of the economy is a canyon sized rabbit hole that I can’t even begin to navigate.
And even then, there’s a greater argument to be made that favors a different mode of thinking – It’s the fact that to win a game of Counter Strike, you just need to win 13 rounds. It doesn’t matter what your economy is in those rounds, you could even win all 13 of those rounds without buying anything in-game. All that matters is that your team has 13 round wins by the end of regulation.
So this is the approach we’ll take to quantifying value in Counter Strike. In this series of articles, we’ll be re-examining the statistics of Counter Strike and attempt to reformulate them in a way that both captures and expresses value in a way that will redefine how we evaluate players.
A Question to Die For
Recently I’ve been writing a lot about kills. Multikills, opening kills, kills kills, all types of kills. Why do I talk about kills? Because kills are fun (in CS. Not like, you know. I mean maybe in other games too, but past that? No way Jose.)
It’s very easy to focus on the players that get a lot of kills, because kills are flashy, kills are exciting, kills are ACTION. But every action has an equal and opposite reaction, and that’s where deaths come in. And eventually we had to talk about them.
Now conventional wisdom is you take deaths as a consequence of the kills because, most importantly, kills win rounds. You can’t sit in spawn forever Jame, or sh1ro, or [list any other baiter you want and expect to win rounds]. Right? Well…
First and foremost kills are deaths, and deaths are (usually) kills. It should make sense that every kill is equal to a death. But, as we looked at in my original article on how much a kill is worth, not all kills are worth the same. And by extension, that means not all deaths are worth the same.
Deaths are fundamentally different than kills from an individual’s perspective in one distinct way: No matter how hard you try (and lord knows chelo tries), you can only ever die once in a round. Meanwhile, you can get multiple kills in a round. That was the entire premise of the first article in this series, the idea that not all kills are worth the same because some kills are part of multikill contributions and those multikills have diminishing returns when compared to splitting those kills across multiple rounds.
We can’t examine that exact behavior with deaths because they don’t work the same. However, we can do something similar. Instead of just looking at kills contributions, we can combine that with deaths to see how impactful dying is. We can also look at the difference in contributions between the CT and T side to get a better picture of how the two sides contrast. Those things are what we will be focusing on below.
Our sample for this exercise is every Big Event in 2025 leading up to, but not including, Austin. So to clarify, that’s Bounty Finals, Katowice, Cluj-Napoca, EPL, Lisbon, Bucharest, Melbourne, Rivals, Astana, and Dallas. The play in for Katowice is not included.
Before we get started, it’s important to compare the numbers we already collected in previous articles to what we have now just to get a gauge for if things have changed.
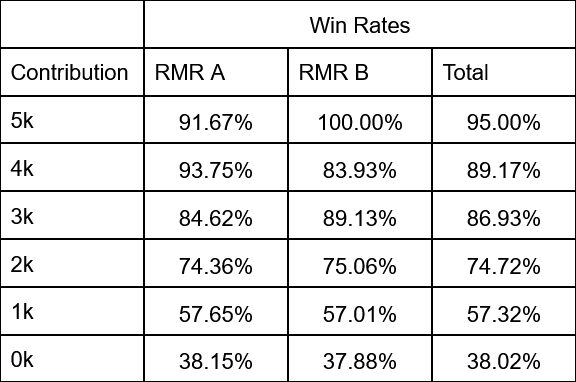
Those are the win rates for the Copenhagen European RMRs over a year ago. And these are the win rates for 2025 Big Events:
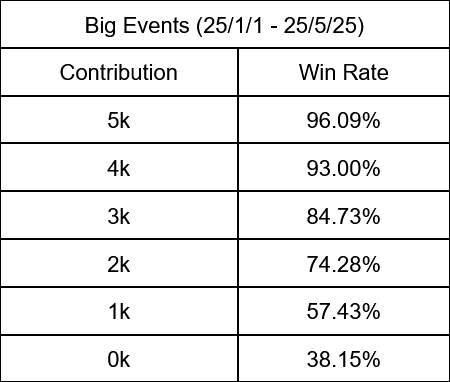
So pretty similar. The only major deviation is with 4ks and the widening of the gap between them and 3ks, which was to be expected with a greater sample. Everything else remains practically the same. Good to know that in a year’s span the game didn’t drastically change or anything.
However, while these multikills stats are cool, they don’t really give us much context. There are the aforementioned deaths, but there is also a fundamental difference between the two sides of counter strike that I’ve failed to discuss before, and understanding those differences is imperative to understand the game itself.
The first thing we can do is look at the bare bones stats, because while we might understand that all players average around 0.65 KPR, the average on either side isn’t really discussed. So what are the basic K/D stats for both sides?
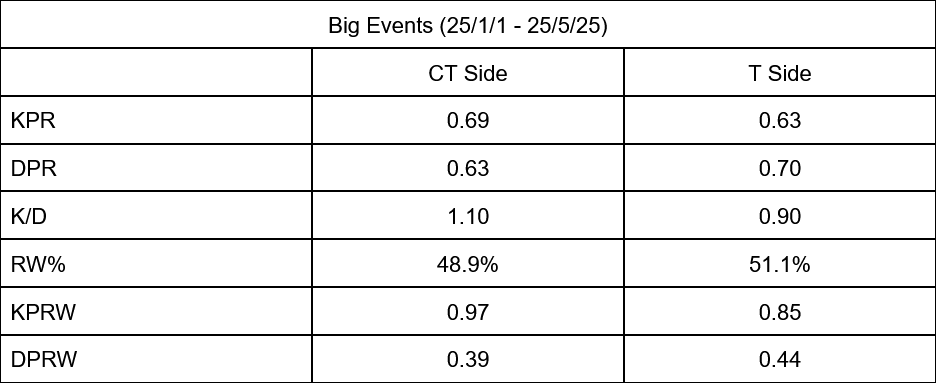
So at a baseline, the CT side gets more kills and dies less, which results in a higher KD. Just to put this into context, the difference between the two sides is basically the difference between Graviti and KSCERATO at Big Events this year. Which is to say, it’s a pretty big gap.
On the flip side, it’s more difficult to have better stats on T side, and this is all in spite of a currently T sided meta. You could imagine how much worse it could be in a meta that was CT sided, but for now we don’t have that.
(Just as a note because I didn’t know where else to put this – donk’s KPR this year on T side at Big Events (0.96) is nearly as high as the average winning player on CT side at big events this year (0.97). ZywOo’s KPR for both sides combined is only at the T side winning average of 0.85. In other words, donk is a freak.)
So with the basics out of the way, we can examine some of the more advanced numbers, including the multikills we talked about. I’ve also included 5v4% because it ties into the two distinct differences between each side.
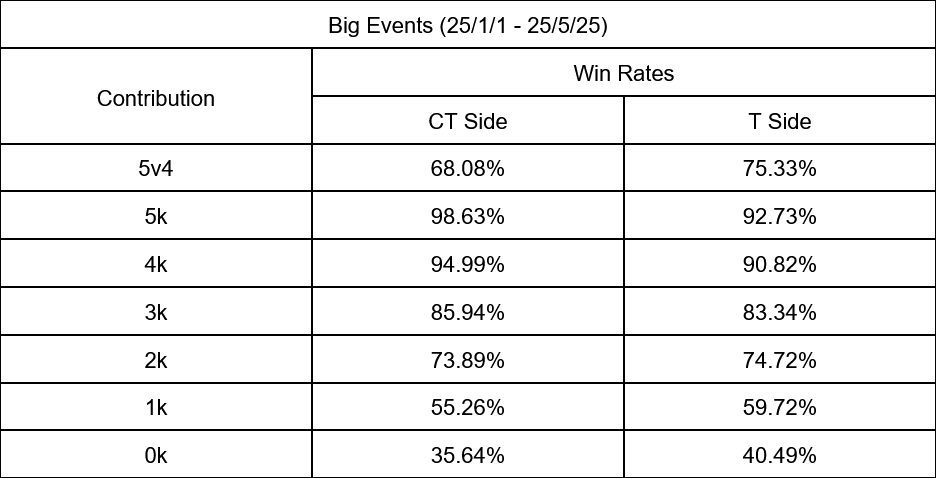
One thing I didn’t mention in the flameZ article is that, a 5v4 on T side gives you a much better chance to win than a 5v4 on CT. Meanwhile, you can see that multikills (generally) have higher win percentages on the CT side. In combination with what we discussed earlier, this makes a lot of sense.
Because there are less kills on the T side, that makes every kill much more impactful, hence why 5v4’s have a higher win rate. On the flip side, the CT side requires more kills to win, so multikills are more important. So if you want to look at certain stats to determine success on either side, multikills are more important for CT sides and opening kills are more important for T sides.
So now what happens if we include deaths in these numbers? Well, let’s see:
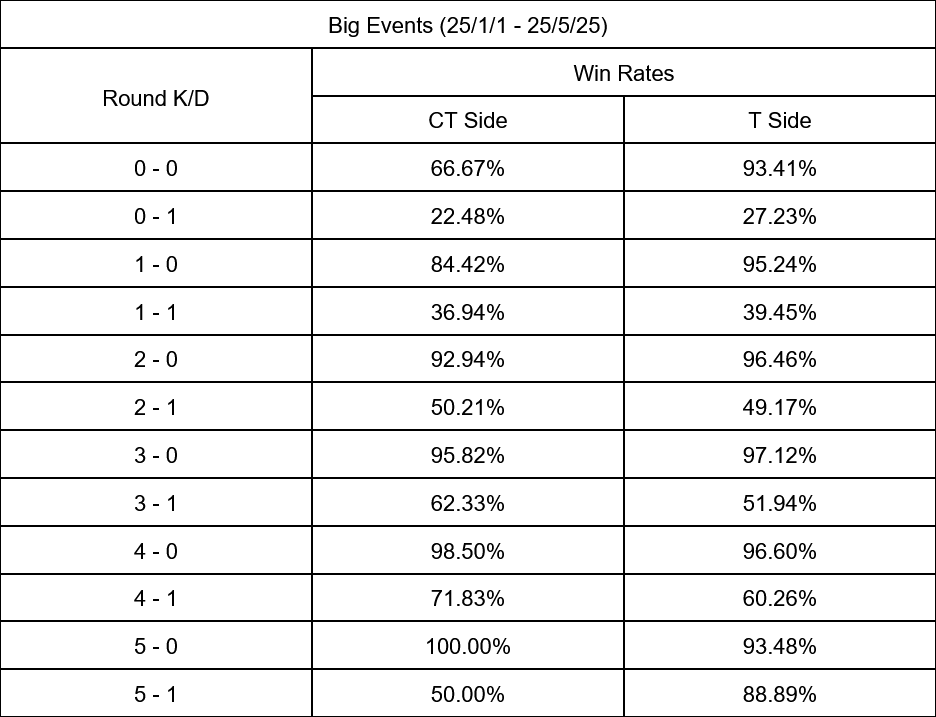
This is a pretty big table with a lot of information and it’s not really clear where to look, so I’ll opt to use a couple bar graphs instead.


There’s an obvious conclusion here and it should go without saying – no matter how many kills you get, dying in a round is really really bad. In fact, if you get two kills and die on CT side, you are *barely* winning more than half of your rounds played, and on the T side you lose more than you win.
It’s also surprising just how much *not dying* wins rounds. Especially on the T side, if you never die you’re winning over 90% of rounds no matter how many kills you get. Even on CT side where saving is more prevalent, you’re winning 2/3rds of your rounds even when you don’t get a kill as long as you don’t die.
And now just as we did in the original article, we can multiply the occurrences of these rounds for each player to get how many rounds we expect that player to win over their sample of rounds played.
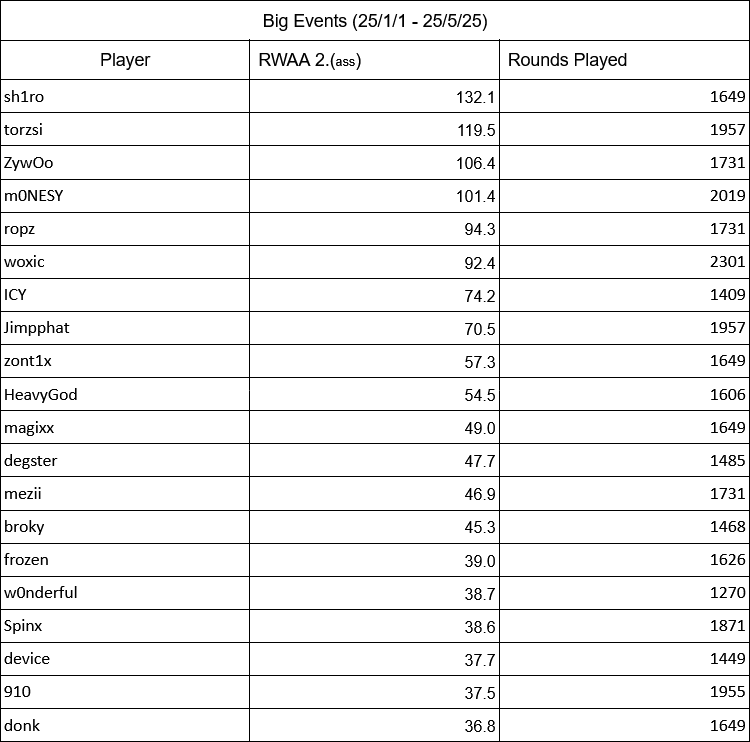
Well this is… extremely flawed to say the least, and we’ll talk about those flaws later. As expected there’s a huge emphasis on not dying with a stat like this and the players that die the least are baiters and AWPers (and at the top, a baiting AWPer). But I’m also working on win probability and this leaderboard lines up decently well?
Basically 16/20 players here also show up on my *wip* WPA top 20 so far this year, with the four not included being Jimpphat, zont1x, magixx, and mezii. Now those four players do represent the supportive elements of what have basically been the best three teams this year. But they also aren’t the reason those teams are winning, and donk being 20th here is sort of an indictment of this stats’ flaws.
And speaking of flaws, while a stat like this is interesting to look at, there’s a fundamental problem with it. Going back to my flameZ article, I defined what I think a rating system should be. That definition was “the value of an individual’s contribution”. And if you recall how I described what “contribution” means, I said you should actually need to *do something* to “gain” rating.
Though the impact of not dying is indisputable, the action of not dying isn’t really a contribution. While on T side you are winning 90+% of the time by not dying, that doesn’t mean you should optimize your play to die the least, that’s infamously what was one of Jame and Virtus.pro’s flaws while they were competing at the top.
Not dying is good, but you can’t just recruit a Counter Strike hide and seek champion and expect to win 90% of your rounds, that’s not how the game works. So despite the inarguable fact that dying is bad, if you specifically optimize to not die in all situations, you’re never going to win.
That’s why I’m not going to use this stat for further examination, because while the conclusions you can come to with it are interesting, the stat overall is a miss more than a hit.
So then, what’s the purpose of this article? Well firstly, it might make you rethink how you value players who needlessly throw their lives away. While you shouldn’t specifically optimize not dying, some players don’t truly recognize the value of staying alive, and dying in stupid ways can really fuck over your team and drastically lower your chances of winning. You may want to remember this fact before going for your next high-risk low-reward play.
Secondly, it’s just important to understand the game on a fundamental level if we want to continue furthering the game forward. When we’re watching the game, or even playing it ourselves, it’s important to have the correct gauge on the value of our actions in the game. The highlights are nice and cool, but highlights aren’t what wins games, and you always need to keep that in mind.
Lastly, this article serves as a stepping stone for future articles. I’ve already started my own work on looking into win probability and applying it to Counter Strike statistics. This isn’t just the path that I’m taking, but that CS is taking as a whole. HLTV 3.0 is going to look a lot different than 2.0/2.1 because of its usage of win probability, and while Leetify rating is a little less accessible, it’s been ahead of the curve.
So that’s the way the game is heading, and I hope that those that choose to read find this useful in their understanding of the game we love.
Afterword
As I said earlier, I’m already working on the numbers for my next article talking about win probability, and I hope to have that done soon-ish but it’s going to be a lot more than just looking at raw WPA and there will be a lot of adjusting to it to get it to a spot I’m happy with. After that, I hope to either continue that or look more into doing my own aim statistics but that’s not something I’m super hopeful about but we’ll see.
Also I just wanna say I’m using Python and Awpy to parse these demos to get the stats and sometimes the numbers don’t line up perfectly with what’s on, for example, HLTV. It’s still fairly accurate, just not 100%
As always though, thank you for reading, and I hope you have a good day.
to what extent, will your WPA be similar to RS by HLTV?