


Which Players Win the Most Rounds?
it should be more like "most round (win probability)" but that doesn't roll off the tongue as well

When it comes to playing Counter Strike, the value of your plays is a mystery. Not even delving into the many nuances of the word itself, it’s not very clear what value even *is* in Counter Strike.
You might be tempted to look at the in-game economy, as the words “value” and “economy” go hand in hand, and you would be completely justified in saying that. However, while observing the economy in real time isn’t so difficult, beginning to think about quantifying how “value” works in the context of the economy is a canyon sized rabbit hole that I can’t even begin to navigate.
And even then, there’s a greater argument to be made that favors a different mode of thinking – It’s the fact that to win a game of Counter Strike, you just need to win 13 rounds. It doesn’t matter what your economy is in those rounds, you could even win all 13 of those rounds without buying anything in-game. All that matters is that your team has 13 round wins by the end of regulation.
So this is the approach we’ll take to quantifying value in Counter Strike. In this series of articles, we’ll be re-examining the statistics of Counter Strike and attempt to reformulate them in a way that both captures and expresses value in a way that will redefine how we evaluate players.
So I’ve written about kills and I’ve written about deaths, but up until now everything I’ve written about has been context-neutral. What that means is, every action we’ve attributed to a player has been equal regardless of the greater context around it.
For instance, when looking at single kill contributions, an opening kill is worth as much as an exit kill. Or another instance, a death in a 2v2 is counted the same as a death in a 5v5. These are fundamentally different value-wise but for the purposes of the previous articles we’ve counted them the same.
And there is validity to using context-neutral stats. For instance, no player has the power to warp reality to their will (unless you’re Aleksib). You can’t control the other nine players on the server, and by extension a player has limited control over the sequence of actions throughout the course of a round.
However, while you can’t solely dictate the pace of a round, you have a lot more control over that sequence than in other sports. Baseball, for example, has a set lineup where you must wait in line for your turn to contribute, and you can’t control what the people in front of you or behind you do. CS doesn’t have mechanisms like this, there is nothing holding you back from stepping in and doing something.
If you want to peek mid every round and die, nothing will stop you. If you want to sit and spawn and wait until your teammates die, go for it. Want to AWP this round, sure why not? You can be the fighter or the flasher, and you can change that on a whim from round to round. CS ultimately has a lot of flexibility.
While you can’t single-handedly control the outcome of a match, one of the reasons CS is so captivating is because of the way players can insert their will into the game.
So while context-neutral stats have a place in our game, CS ultimately has the best arguments in favor of context-dependent stats compared to almost any other sport. So how do we measure that context? That’s where win probability comes in.
Win Probability Added
Win Probability Added (WPA) is a mechanism we can use to dynamically value kills and deaths, but what is win probability?
In short, win probability is a team’s chance to win a round at any given moment. If we want to measure win probability added, we simply look at a player’s actions in the round (such as a kill or death), and we look at their team’s win probability before that action and after that action. Then we take the difference of those two to get how much they added to their team’s win probability. This equation sums up what I said in a simpler package.
Win Probability before action
+
Win Probability Added (WPA)
=
Win Probability after action
So then how do we get these win probabilities? Well, thankfully we have computers. I used a Python script with Awpy to track the different round states and look at how often a team won after each given round state. In this case a round state is how many players are alive on both the CT and T side.
Note that due to either demos being weird or subpar coding (probably both), these probabilities are *slightly* off, but they should still be good enough to use for the purposes of our evaluations. So I downloaded every Big Event demo from this year (Bounty -> Dallas) and ran them through this script, and this is the result for all rounds:
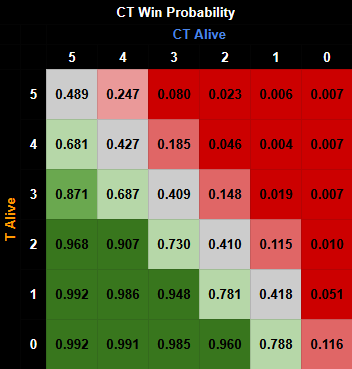

This is the “round win matrix” showcasing the win probabilities for both sides. You can easily get one sides matrix from the other by using the following formulas:
1 - (CT XvY Win Probability) = (T YvX Win Probability)
1 - (T YvX Win Probability) = (CT XvY Win Probability)
Where X is the number of CTs alive and Y is the number Ts alive. For the purposes of simplicity, for the rest of this article we’ll be using the CT Win Probability chart by default.
Now how can we turn this into player statistics? Well as stated, we just need to use the difference between the probabilities for kills and deaths. Now there are actually two methods to use for tracking this stat, we can use a cumulative stat and a rate stat.
The cumulative stat is what happens when we don’t divide the stat at all. For every kill/round winning event we add the probability and for every death/round losing event we subtract the probability. If you’ve read my prior articles, this is in essence what Round Wins Above Average (RWAA) is. Every time your win probability adds up to one, that is equal to one ‘Round Win’, so looking at how many more you have more than the average is the total “Round Wins Above Average”.
The rate stat is what Leetify Rating and HLTV’s “Round Swing” are, it looks at the average percentage gain in win probability per round. So you take the total WPA gain and divide it by rounds played. My version of WPA will be different from these alternatives in a couple ways.
Firstly, for now I am not including any economic data. I might look into more economy stuff in the future, but for now the probabilities I’m using are the same for all rounds.
Secondly, I am not including assists or trading or ultimately anything that is secondary to kills and deaths. I am opposed to including those metrics in something like this because I intend for this to be as individual a stat as I can make it. That’s not to say those stats don’t have a place in Counter Strike analysis as a whole, quite the opposite, but they should be considered separately. If you would like to read more of my arguments on this, read my article about the most overrated player in the world.
Now you might be thinking: “but isn’t this just a glorified K-D?”. Well, yeah it is (although all stats CS ratings really are). But the point of a stat like this is that we can comprehensively value kills and deaths in a consistent manner. In other words, there are no arbitrary valuations, the only values present are present in the data.
Aside from those, other stipulations include the following:
You lose win probability for saving
You gain win probability for defusing
You lose win probability for team killing
Any kills after the round officially concludes (time expires or bomb is defused/detonated) aren’t counted for win probability.
With that being said, here are the 20 best players of the season up until the major:
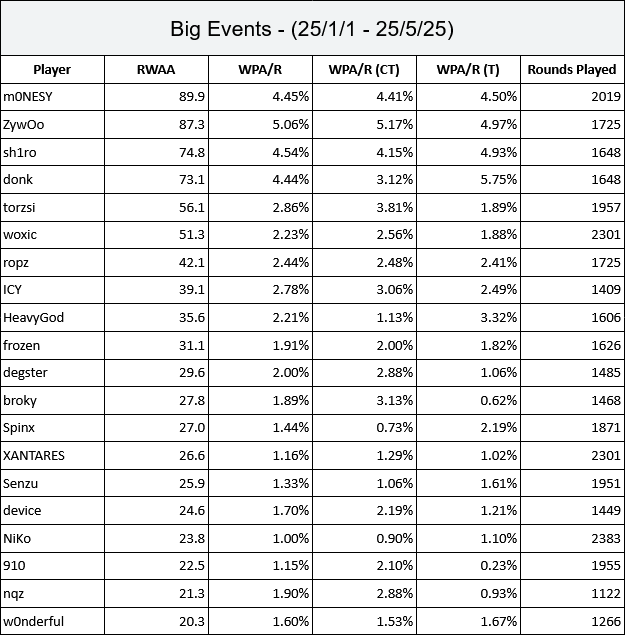
The table is ranked by RWAA, so if you’ve played more rounds than others you gain a bigger advantage. The purpose of RWAA is to value performance over time, so as to quantify the total “value” (in this case, round wins) a player has accrued in total.
The first thing you might notice is that m0NESY is at the top; however, he’s third in our rate stat WPA/R behind ZywOo and sh1ro, and is basically tied with donk. Again, the reason he’s at the top is because of the rounds played, and if you used some sort of ranking filter he would most likely not be at the top spot, but this is just all of the matches from the Big Events so that isn’t considered.
The second thing you might notice is that there are a lot of AWPers. AWPers generally have play styles more suited for gaining WPA because they often are alive late round and take more risk averse duels compared to riflers. AWPers also generally perform much better than riflers on the CT side. All of this suggests that your team’s most important player is your AWPer, which probably isn’t a controversial statement. What is controversial is saying that these players are better than riflers that are placed lower or not present on the list. We’ll account for this discrepancy later.
In terms of the biggest surprise on the list, HeavyGod ranks very highly for someone who is practically a newcomer to regular tier one play, and we’ll discuss later how he might even be underrated on this particular list. As for the other rifles, donk, frozen, Spinx, XANTARES, Senzu, and NiKo are all world class riflers in their own right. Again though, there are no filters on these maps so Senzu isn’t docked for being a playoff choker.
Map Adjustments
But looking at WPA like this doesn’t really make sense. While many other sports have standardized environments, Counter Strike is very different. In CS, instead of just one field, we play on seven completely unique maps which have their own styles and biases. For instance, Anubis has a T side win rate north of 57% this year, while Nuke has a T side win rate of only around 48%. These are fundamentally different maps and WPA should treat them differently.
So that’s what we’ll do, instead of just using a general Round Win Matrix for every map, we can make separate matrices for every single map in rotation. Then we can calculate every individual’s WPA per map and add them together.
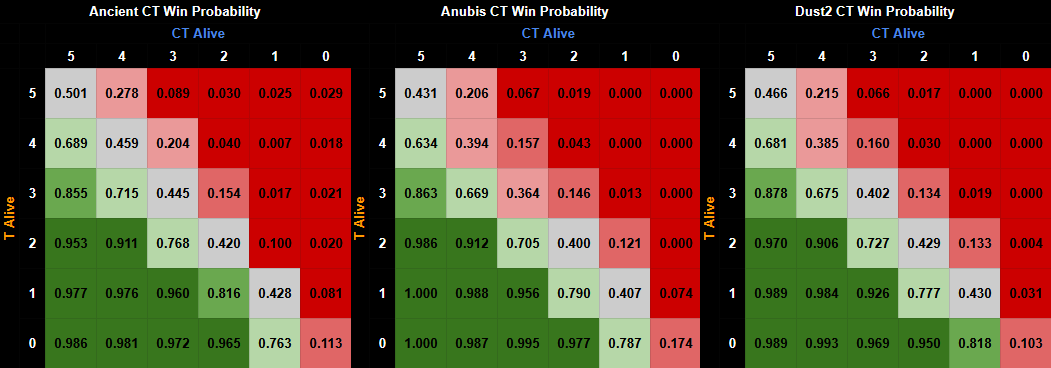

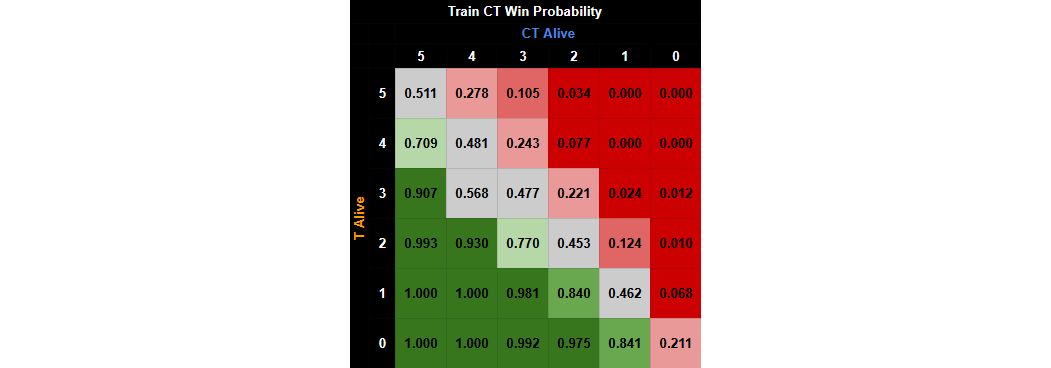
There are all seven matrices, and here are the Top 20 players with this map adjusted WPA:

Hey ZywOo passed m0NESY! However, basically the entire list is the same. In fact, every player listed here was also on the previous list, the only difference is that some of the places changed slightly. But doing the map adjustments also gives us the power to do even greater, and now it’s time we properly address the AWPers.
The AWPing Question
The first thing we need to explain is why this is a problem. Because in some ways, it’s important to recognize which players have the best stats without the adjustment. Yes a bunch of AWPers populate this list, but it can be argued they should because they do add the most “raw” probability to win. As we stated earlier, in CS you have the free reign to do basically anything, and this list of players make the most of the free reign that they are given.
However we also live in an era where teams are increasingly “role-pilled” and positional specialization is increasingly focused on. There is a common understanding that certain roles are “worse” than others, meaning that because of the nature of those roles or their literal position on the map. Or to put it simply, a B anchor is never going to have the same raw output as a good AWPer because the nature of the positions are so fundamentally different.
Not to mention, if AWPers generally have higher outputs than other positions, they should also naturally be under the most scrutiny because of how important the position is. It’s not enough to just be an average *player* with the AWP, you need to be at least an average *AWPer* to add value.
But we can also extend this idea to all positions, not just AWPers. To properly examine players, we need to scrutinize them relative to what positions they play and how they perform in those positions in comparison to other players. The value of two given players with *average* stats will have a great disparity if one of them plays in a low output position and the other plays in a high output position. So, how do we solve this issue?
That’s where positional adjustments come in. We already explored the different win probabilities per map, we can also explore the win probabilities on average for every position on every map as well. Using NER0’s Positions Database, we can mark down the positions for players on every map and then calculate the output for each position on every map. Then from there, we can adjust each player’s ratings by subtracting the average WPA for their position on every map, thus truly giving us the Round Wins Above Average (per position).
Now this isn’t a foolproof method because some players have changed position over the course of the season and not *every* player is in the database because of sample size or being teamless or some other reason, but it should be good enough for the purposes of what we’re doing. Maybe in the future I can find the positions myself and see what output comes from which positions but that’s so far from now that I’m not currently considering it.
Before I post these final adjusted stats, let’s examine some of the positional adjustments per map. Firstly, AWPers, as a position, have the highest WPA/R on both sides on every single map. The lowest AWPing role by WPA/R is on the T side of Ancient at 1.11%, which is still higher than every single rifle position on every other map. A part of me thinks that the AWPing might be *too* bogged down by this adjustment, probably in part because you have three AWP prodigies who boost the average a lot. You’ll see in the final stats that it punishes some players which have very strong AWPing reputations (like 910 for example), but for now there isn’t really anything we can do about it.
As for highest rifle positions, the five roles with the highest average WPA are:
Mirage T - A Extremity: 0.96%
Mirage CT - B Short: 0.94%
Train CT - B Anchor: 0.90%
Anubis CT - Middle: 0.87%
Dust2 CT - Middle: 0.67%
And the five lowest:
Mirage T - Roamer: -2.86%
Dust2 T - Middle: -2.49%
Inferno T - Roamer: -2.46%
Ancient CT - B Cave: -2.09%
Anubis T - Canals: -1.98%
Now as for some context, “Roamer” on T side is basically just the IGL role, because they don’t really have a singular set spot they play or go to regularly, they just dictate the tactic and go wherever necessary. So it makes sense that these roles are the lowest because IGLs usually are the worst players by statistical output.
As for the best positions, it might be surprising to see the B Anchor on Train here, but perhaps it’s also the most dissimilar to the usual anchor positions you think about on other maps. However, it’s also important to note that WPA doesn’t discriminate against lower traditional output roles (i.e. roles with a lower KPR) as much as something like HLTV 2.0/2.1 does.
As for the other positions, all of the positional averages will be linked in a spreadsheet at the end which also includes all of the player stats.
So now that we have the positional averages, the calculation for player stats is as follows:
Firstly, calculate their WPA for every map. Then find their position on both sides for every map. Once you do that, take that player’s WPA/R for each side and subtract the average WPA/R for their position to get that player’s adjusted Win Probability Added per Round (aWPA/R). Then use that aWPA/R and multiply it by the rounds played to get their total positional adjusted Round Wins Above Average.
Just to make this even clearer, let’s use mzinho on Ancient as an example.
mzinho on Ancient has a WPA per round of 0.68%. On CT side, his WPA/r is 2.49% and on T side it’s -0.95%. His CT side position in the database is “A Anchor”, and his T side position is “A Extremity”. The average A Anchor on CT side Ancient has a WPA/r of 0.07%, while the average A Extremity player On T side Ancient has a WPA/r of -0.495%. So we take mzinho’s CT WPA/r of 2.49% and subtract 0.07% to get his adjusted CT WPA/r of 2.42%. Then we take his T WPA/r of -0.95% and we subtract -0.50% (i.e. we add 0.495%) to get his adjusted T WPA/r of -0.46%. We multiply both of these values by his total rounds played on both sides(176 CT, 195 T) to get his round wins above average on both sides, then add them together to get his total RWAA for the map, which works out to about 3.9.
Now before we do the final tally, let’s look at the top 5 per map.

Senzu has a pretty commanding lead, mainly due to his rounds played and his high proficiency on the T side. Also poor degster for not having a team while still being one of the best AWPers on Ancient.
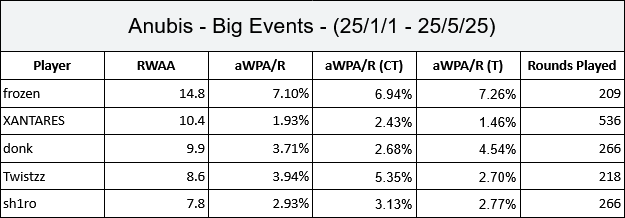
You can see just from watching their matches that frozen is probably the biggest reason for FaZe’s success on Anubis this year, and the stats firmly back this up. He has less than half the rounds played of XANTARES, but still has won 4 rounds more than him. sh1ro also appearing on a second top five is impressive.

If you’ve ever looked at donk’s traditional stats on Dust2, it shouldn’t come as a surprise he’s at the top. However, it may still be surprising that he’s *more than double* the amount of anybody else. That number two spot being HeavyGod may also surprise you.

Not only is ZywOo at the top of Inferno, so are two other Frenchmen and two other Vitality members. The fact a majority of Vitality is here is not surprising, they were 19-1 on this map going into the major. What will be surprising is the second best player being Lucky. 3DMAX have been quite adept on the map this year, and it seems in no small part because of Lucky’s play on Banana.

b1t at the top on the one map Na’Vi are still world class on, he gets an extra boost for the fact he’s their A Anchor. While his raw CT WPA/R is slightly negative, the A Anchor on Mirage actually has the second lowest WPA/R of any CT position on any map, and the sixth lowest across both sides, which leads to his very slight negative being a huge positive compared to the average A Anchor.
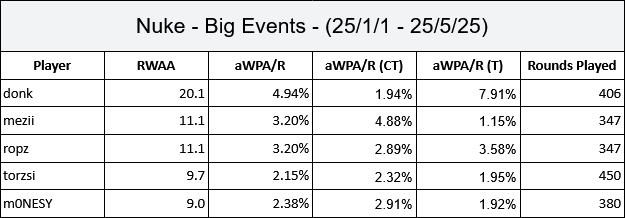
Okay donk, lapping the competition on one map is one thing, but a second? Not cool man. Also look at mezii being as valuable as ropz on this map, I definitely didn’t expect that.

As an American, I’ll gladly take these results. sjuush placing on the list after playing just one Big Event is surprising, but considering the map is the least played in the pool it’s not *too* surprising.
And now for the moment we’ve been waiting for, the Top 20 by RWAA so far leading up to the first major of 2025:
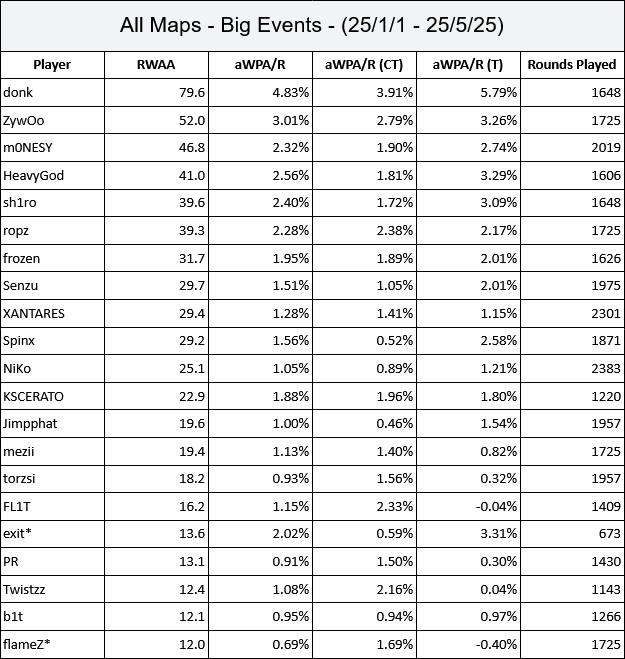
The first thing we should address on this list is exit who is extremely out of place and I think I know why he’s here.
As you might know, at the beginning of the year, drop was the IGL of MIBR and exit was just a player on that roster as well. At Cluj-Napoca, exit was also MIBR’s highest rated player. In the time between then and now though, drop was replaced and exit became IGL, and he presumably took over a lot of drop’s positions on a lot of maps.
So I think what happened is that exit is getting the positional adjustments for the worst positions where he is fragging like a dog now, but he’s also getting that adjustment for Cluj, where he was very good but wasn’t in the positions that he is now. It’s just one of the limitations of my methodology; if you want to replace him on the list the next in line at 21st would be flameZ which seems much more in line with what we would expect from a list like this (just not fucking seventh please).
As for the rest of the list, donk is in the lead by a significantly significant margin and WOW HeavyGod is really really high. Well keep in mind, he was already pretty high just looking at un-adjusted win probability and the AWPers around him were punished a lot. Meanwhile he was getting high output from relatively low output positions, at least comparably.
For example, on the CT side of Dust2 he plays Long which is the worst CT position on the map by WPA, and the third worst CT position overall. He’s also 2nd best on Ancient because he excels while playing the 2 lowest output positions on both T and CT side.
Is he the fourth best player in the world? Probably not, G2 hasn’t featured in many playoffs or even just matches against fellow Top 10 teams for that matter. But this mode of analysis shows how valuable a player like HeavyGod truly is when playing their positions well.
As for the rest of the list, the top seems fairly balanced between role types and I’m very happy with how it turned out. Is it perfect? No, it will really never be perfect, but it seems pretty damn good.
If you would like to see all of the stats for all of the players overall and on each specific map, as well as the positional adjustments for every position on every map, check it all out here: SPREADSHEET
Hopefully, as is always my goal, this analysis has challenged some of your previous notions and made you rethink your beliefs about the game. Remember, this article isn’t meant to serve as an end-all-be-all argument on which player is the best, but rather it’s meant to start conversations, invoke discourse, and ultimately help you understand this game in a new light.
Thank you for reading, I hope you have a good day.
Well this is probably the last article in this mini-series of articles. I’m very happy with RWAA as it stands now. I might still continue to improve RWAA in other ways like with economy and stuff like that but with where it’s at now it seems pretty good and any adjustments will be minuscule at best. Hopefully we see more positional adjustment type analysis like this moving forward and with other ratings as well, it seems like one of the biggest ways we can improve player analysis moving forward.
As for my other plans, hopefully I can do stuff with aim stats, otherwise I’ll be trying to develop other stats that are useful in Counter Strike analysis. Other than that, I might do regular updates with RWAA, perhaps after every event I go through and look at the best performers and whatnot just to keep a running tally. But obviously nothing is set in stone.
I highly doubt I’m gonna be knocking out another article in two weeks like what happened here, but I was wanting to do the last one, figured out Awpy stuff and then realized it wasn’t that big a leap to also do this stuff, so that’s why we’re here.
And if you got this far, again, thank you for reading. If you enjoyed this article enough, I ask that you share it with people you know who might be interested. I haven’t asked that before but this might be my best article, not in terms of writing but just content, and if there’s any article I write which I want people to know me by, then it might just be this one.
Anyways, that’s all for me on this one, take care.
Good read.
HeavyG was not a surprise, he is one of the better anchors rn. (mainly because b1t and jimmy have had a tough year so far), but like many good players in bad teams, not enough sample size vs elite teams and in playoffs to draw any big conclusions. He had a bad start in G2 but has become their best player rn probably.
The rankings at the end are reasonable enough, except the obvious problems i.e groupstage farmers are overrated and opponent strength is not taken into account.
but other than that it seems good.
Bro, could you please tell me the all the best positions' ranking in each map?