

When it comes to playing Counter Strike, the value of your plays is a mystery. Not even delving into the many nuances of the word itself, it’s not very clear what value even *is* in Counter Strike.
You might be tempted to look at the in-game economy, as the words “value” and “economy” go hand in hand, and you would be completely justified in saying that. However, while observing the economy in real time isn’t so difficult, beginning to think about quantifying how “value” works in the context of the economy is a canyon sized rabbit hole that I can’t even begin to navigate.
And even then, there’s a greater argument to be made that favors a different mode of thinking – It’s the fact that to win a game of Counter Strike, you just need to win 13 rounds. It doesn’t matter what your economy is in those rounds, you could even win all 13 of those rounds without buying anything in-game. All that matters is that your team has 13 round wins by the end of regulation.
So this is the approach we’ll take to quantifying value in Counter Strike. In this series of posts, we’ll be re-examining the statistics of Counter Strike and attempt to reformulate them in a way that both captures and expresses value in a way that will redefine how we evaluate players.
The last post I made looked at the correlation of different stats to a team's round win percentage, and the end result was that the version of WPA/r that I made was the best with an R² of .96. But even with how good it was, I knew something was off.
Considering *win* probability added is entirely based on round *wins*, you would actually expect a correlation even closer to one. So I went back and did some double checking and it turns out there was a flaw with the script in terms of giving/losing WPA when it shouldn’t, specifically in post-round scenarios.
So the script is updated now, and the new R² value is 0.9972, which is more in line with what is expected. Now there are still some rounding errors and seemingly one round during Melbourne where something went awry, but overall it’s very very good and a big improvement over what was there before.
However, no matter how improved this win probability is, on its own it doesn’t tell the full story. One specific criticism of WPA is how it punishes aggressive players, and that’s a valid criticism. Win probability, at its core, is an adjusted version of (Kills - Deaths) per Round, and deaths affect your WPA a lot. Aggressive players are also known to die a lot, hence why they are punished so much.
But with the role of the aggressive player, you kind of accept the fact they’ll die more often as long as they regularly put you in the position of winning the round. That is to say that, in the context of the team, the purpose of openers is to set up the closers for late round scenarios rather than participate in those scenarios themselves. In that context, it makes more sense to look at the value that these players add rather than both the value gained and lost.
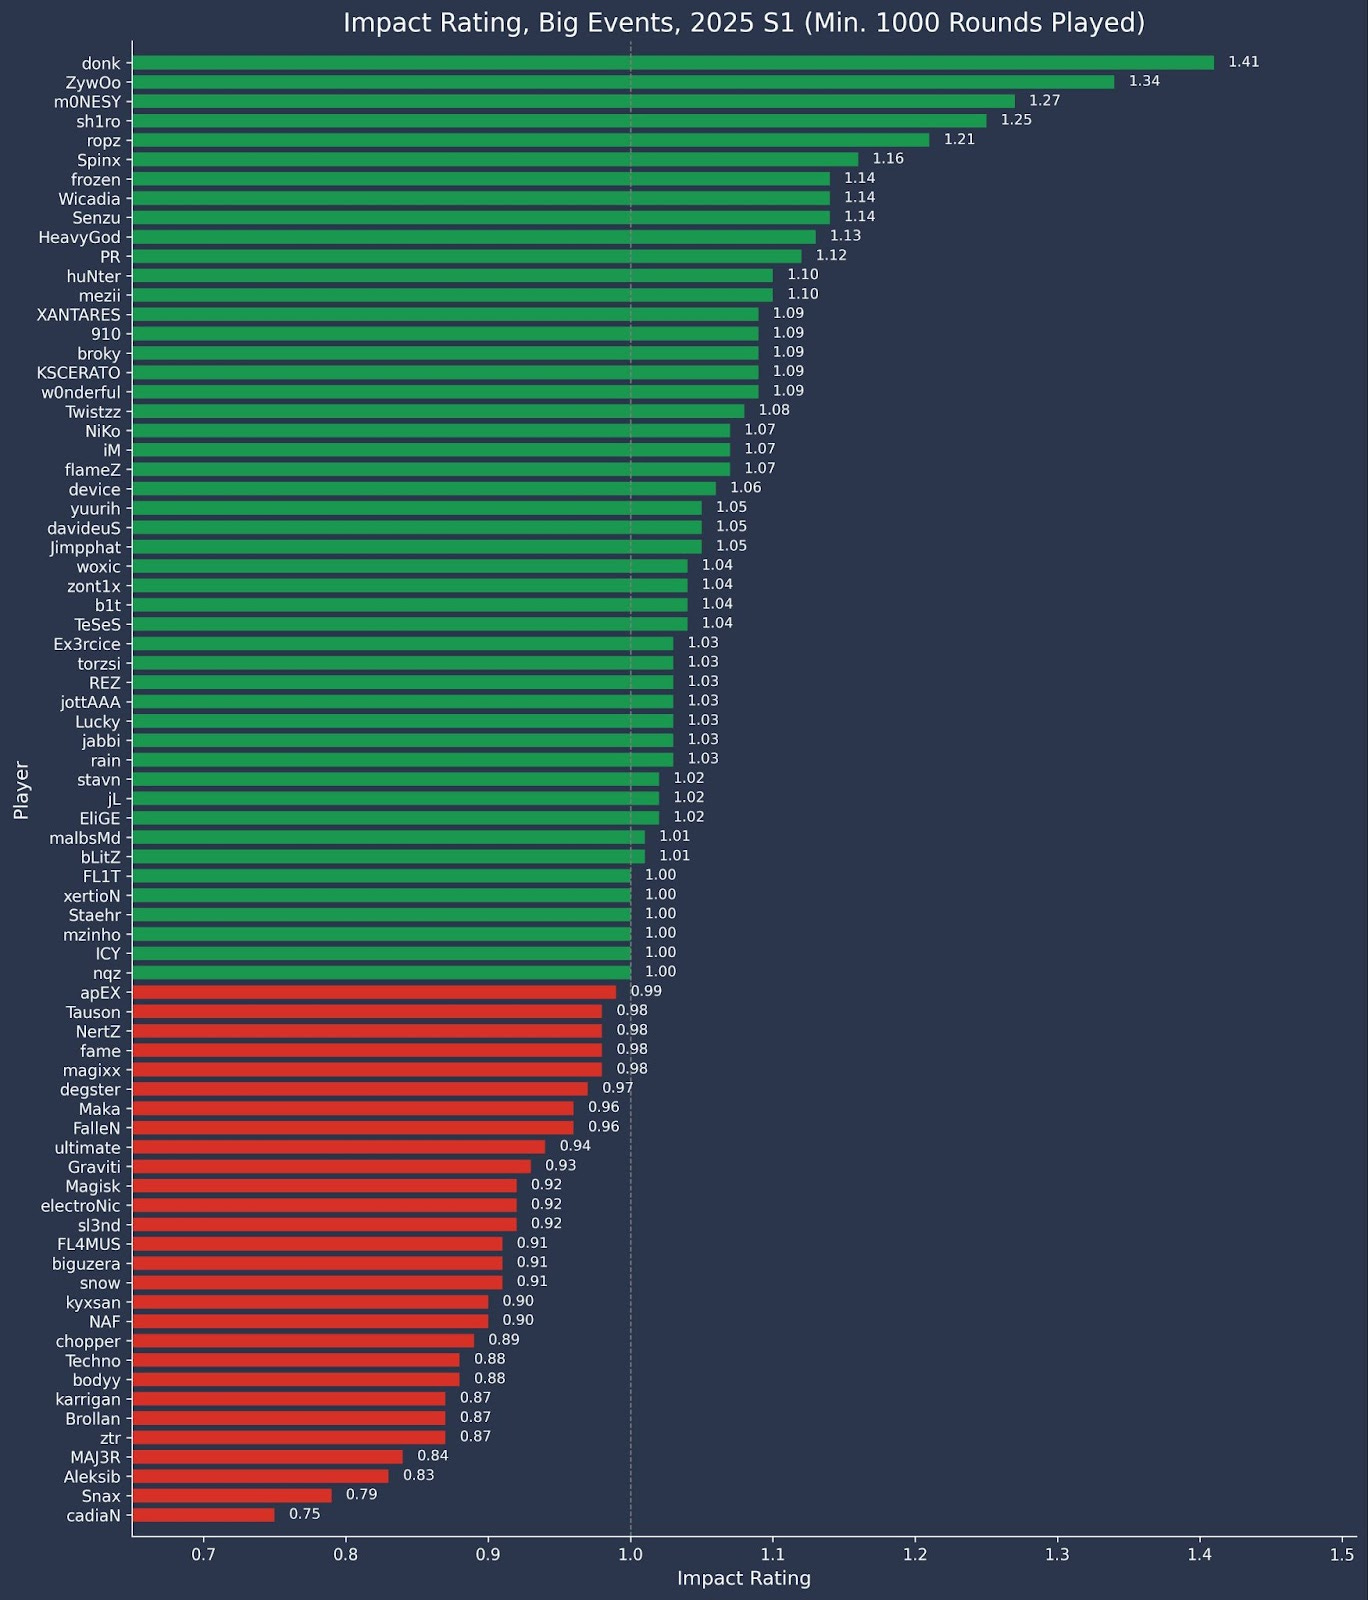
So that’s what I originally did. I simply looked at the average win probability only added per round and made an “impact” stat where 1.00 was the average value added. Which resulted in these numbers:
This was then posted to Reddit and Twitter and it got a lot of attention. There were some comments about certain players being expected or unexpected, but there was an exchange that stuck with me.

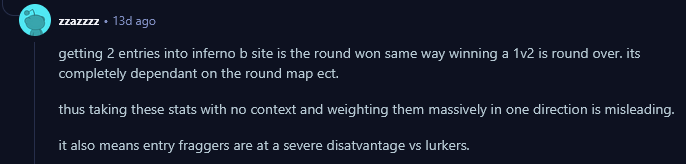
And these are very valid points. If you think back to my post on flameZ, I explained that change in win probability increases with less players alive. Using our previously established win probability matrix, let’s examine how much each situation gives.
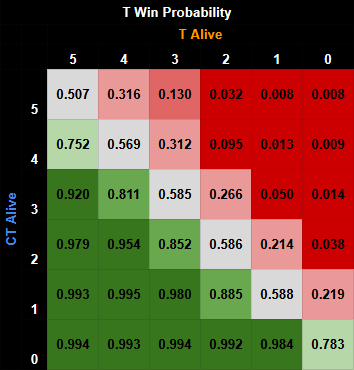
Two entries on T Side: 5v5 -> 5v4 -> 5v3 = 0.507 -> 0.752 -> 0.920 = 0.413 total WPA
1v2 on T side: 1v2 -> 1v1 -> 1v0 - > 1 = 0.214 -> 0.588 -> 0.984 -> 1 = 0.786 total WPA
However, while there’s a big difference in their total WPA earned, the end result WPA of 0.920 and 1.0 are similar enough that it’s worth considering whether these two events should have different weights, given that practically they are almost identical. Both are double kills which result in what are essentially guaranteed round wins.
But okay, we’ve recognized an issue but we haven’t really recognized the issue. To figure out what the issue is we need to understand how WPA works on a fundamental level.
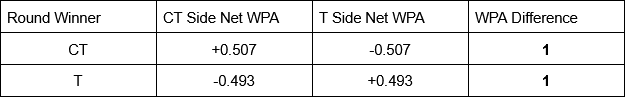
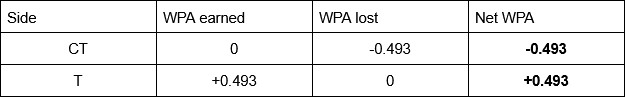
Every round, the T side starts with a win probability of 0.507 and the CT side starts with a win probability of 0.493. When one team wins, their win probability becomes 1. In other words, when a team wins their chance to win is 100%. When the other team loses, their win probability becomes 0. This means that at the end of every round, we have two distinct possibilities that can best be illustrated with this table:
These numbers are consistent for every round that ever occurs. So what does change from round to round? The net WPA will always be the same in the two scenarios, but the total win probability gained and lost can be different from round to round. Let’s draw out potential scenarios for our two situations from earlier.
Let’s extend the double entry scenario to the point where the CT side saves in a 3v5. The WPA gained from the double entry as discussed is 0.413. Once the round ends with a save, the WPA of the T side becomes 1 and the WPA of the CT side becomes 0, so the T side gains another 0.08 WPA and the CT side loses the same. The scenario’s WPA breakdown looks like this:
Now if we look at a potential scenario for the 1v2 win, it might look something like:
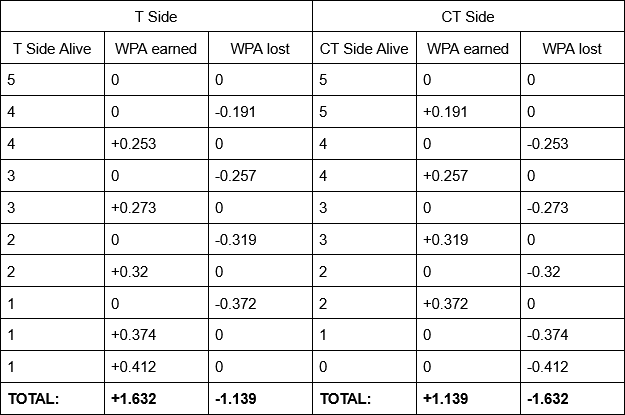
If we compare the two scenarios, you can see that in a potential situation where a 1v2 occurred, a lot more total WPA was gained and lost than the double entry situation.
So really the core issue in both of these scenarios is that you can gain two completely different amounts of win probability, even though at the end of the day two rounds should be equal to the same amount. So how do we make it so that every round has the same total WPA gained?
Well, you can actually just divide. If you divide all gains by the total WPA gained by the winning team, you make it so that in every round won, the winning team gains exactly 1 “win” across the entire team. Instead of measuring just the raw win probability added, what this instead measures is the percentage of a total round win. That sounds a little confusing so let’s explain using our prior examples.
In the double entry example, we already established that the raw win probability gain of the two kills is 0.413. But if we divide 0.413 by the total WPA gained by the winning team, 0.493, we get 83.8%, which means that double entry was 83.8% of the total contribution to that round win. Meanwhile in the 1v2 scenario, the two kills at the end gained 0.786 WPA and the winning team gained a total 1.632, divide the two and you get 48.2% of the total contribution to that round win.
For the observant among you, you might recognize we did just equate these two scenarios hypothetically but instead of making them worth the same here, we’ve essentially just flipped their values instead, and be assured, this will be discussed later.
Now for people that lose the round, we can also do this same exercise by dividing by the winning team’s total WPA gained. You might be wondering why we don’t divide by the losing team’s total gain, but that doesn’t really work. For example, if the losing team only gets one kill, that one kill would be worth one theoretical win even though that team most likely didn’t even come close to winning the round, but we can still divide that kills by the winning team’s total win probability gained and it’ll work out.
For some more context, we can look at the top five players by this stat this year to understand what this means:
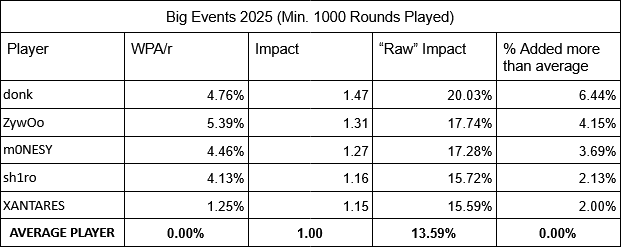
So on the left we have our win probability added per round, then we have our Impact stat, and then on the right is our “raw” impact. Just to clarify from before, the average WPA/r is always 0% because it’s a zero sum metric, meaning all WPA that’s added to someone is subtracted from someone else.
The Impact stat average being equal to one just means that all players' impacts are there within the context of the average player. So when donk’s Impact is 1.47, this also equates to his “raw” impact being 47% more than the average player’s.
The “raw” impact as stated earlier, is the percentage of a total round win added per round. What this means is, on average, donk is adding 20.03% of a round win every single round he plays. What’s especially noteworthy about that number, is that it is (slightly) more than the average winning player per round. Think about it, every round a team wins is 100% of a round win added, and divide that by five for five players on a team, you get exactly 20%. So at Big Events this year, donk is adding as much as an average winning player does every round, win or lose.
Here’s the entire list of those with 1000 rounds played:
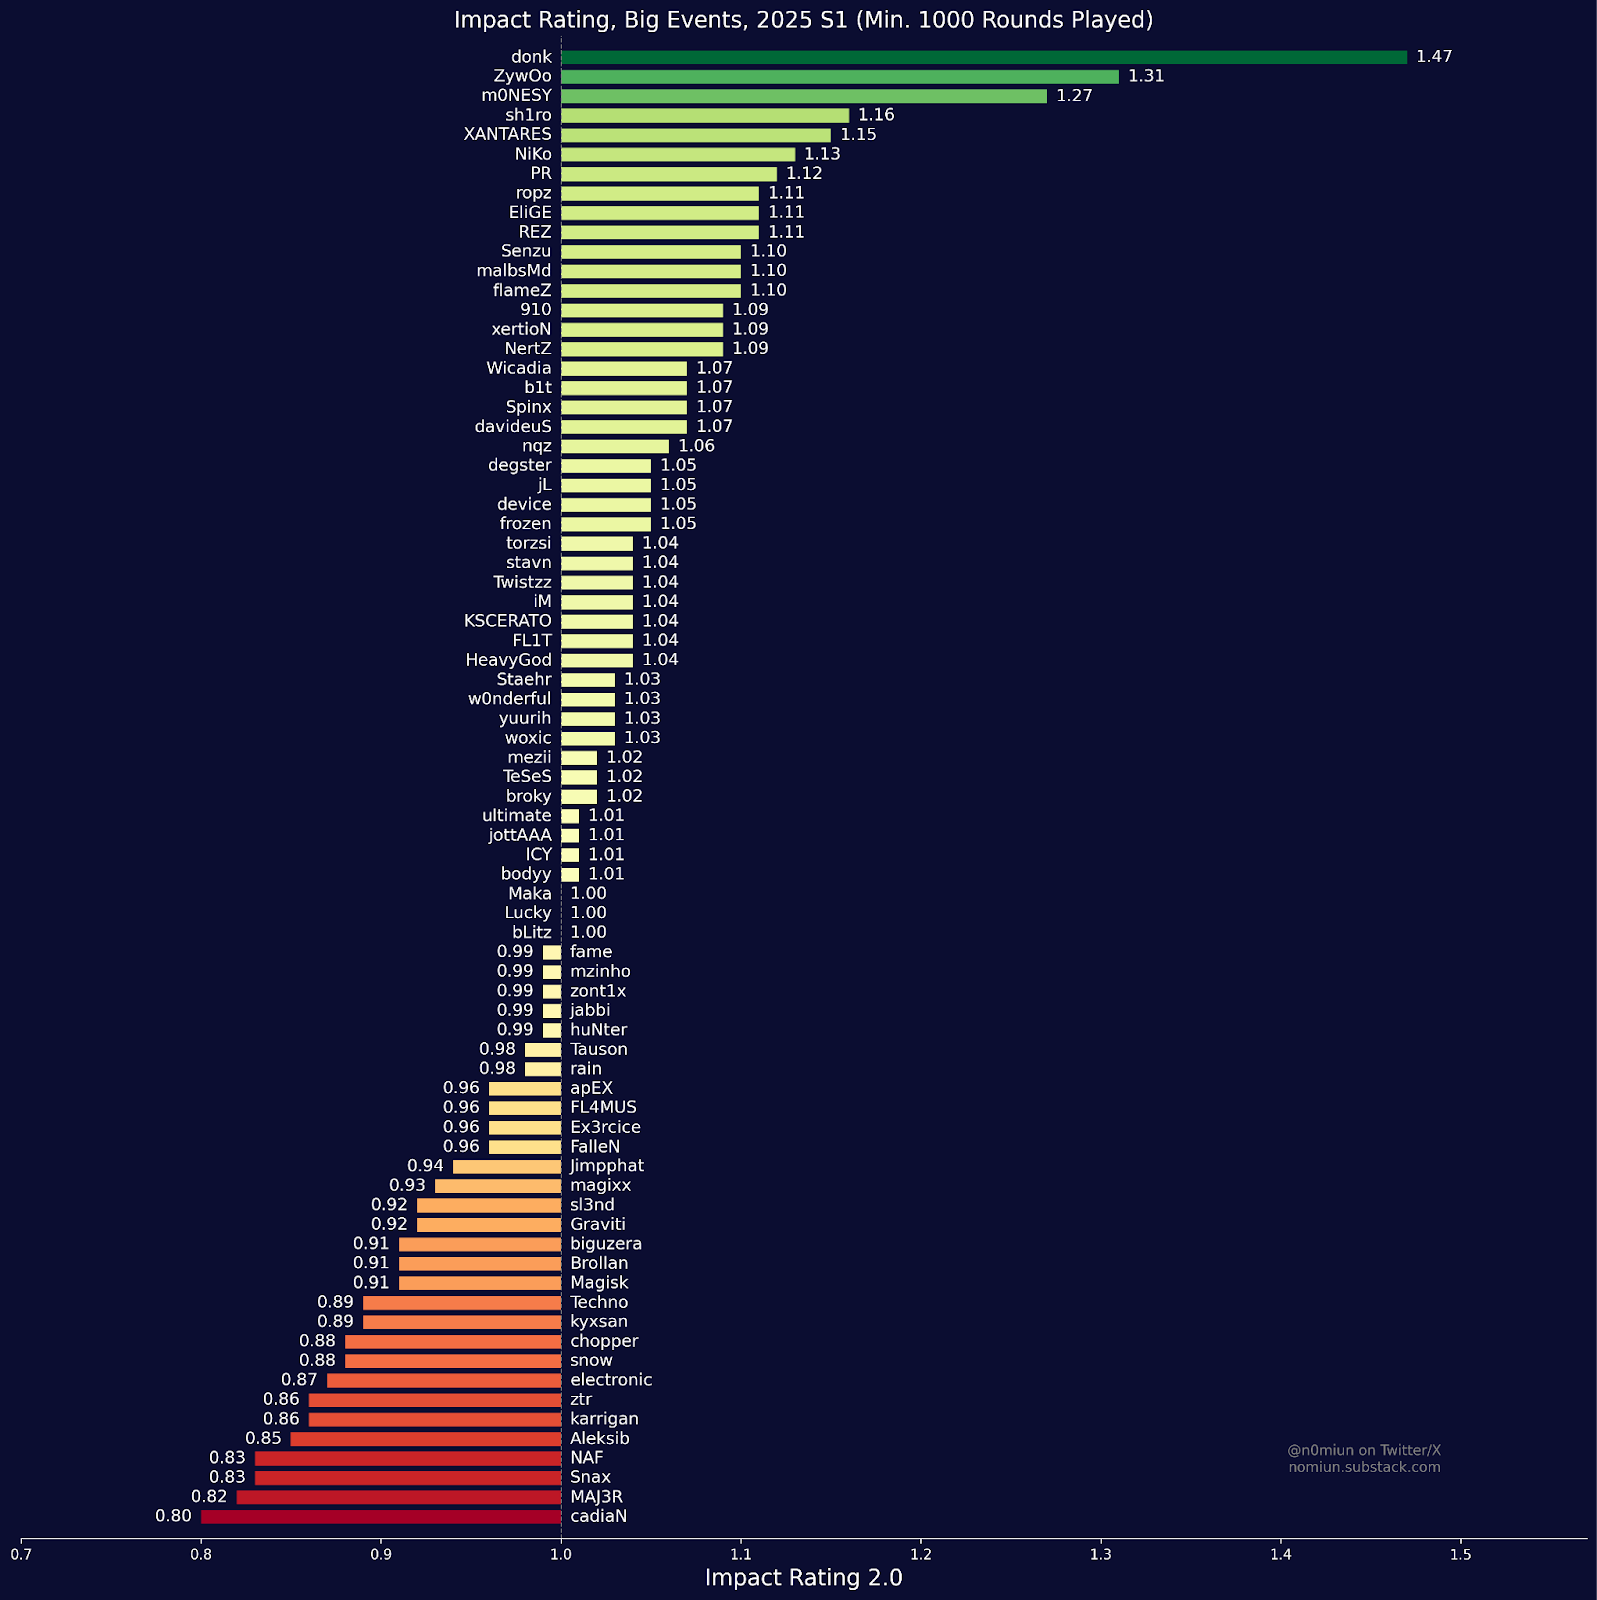
Notice that this Impact stat falls much more in line with what people think of when they think of Impact. For instance, NertZ was highlighted as having below average impact in the original chart, but now he has the highest impact stat among those on Liquid on this chart.
Similarly, other players such as xertioN and malbsMd are rated as some of the most impactful players in the world, even though they are marked as negatives by WPA/r. This means that they still add a ton of value even if their net raw WPAs are negative.
This all sounds well and good, but is this stat actually an improvement? Is there a discernable difference between the original Impact stat and this new version. Well, as we did in the last article, let’s look at the correlation between these stats and round wins.

Wow this is a huge difference. It might not seem like it, but if we compare these numbers to the correlations for other stats from the previous post, Impact 1.0 sits right around KAST and Deaths per Round. Which is to say, it’s pretty decent but not great.
This Impact 2.0 on the other hand, has a higher correlation than all but the improved WPA/r, but this R² value is actually better than the faulty WPA/r stat included in that post. Keep in mind, this stat only looks at value ADDED. In other words, this is a stat that only looks at kills and doesn’t look at deaths yet it outperforms stats such as (K-D)/r and HLTV Rating 2.1 which do include deaths. Not to mention it greatly outperforms similar value-added only metrics such as KPR, ADR, Multikill rate, and rounds with a kill%.
Now you might be wondering, what happens if you do this method and include deaths to make a sort of adjusted win probability added. Well the answer is that it has an R² value of 0.9829 which is better than this Impact stat, but a far cry from the 0.9972 of normal WPA/r. For that reason, we’ll be continuing to use WPA/r but in addition to that also using this Impact stat paired with it.
But okay, there’s a point we skipped over earlier pertaining to the two scenarios that were highlighted. Instead of equating those two scenarios, we’ve basically just flipped the value of those two, isn’t that a problem?
Well, what stats do treat these equally? KPR does, but we’ve already established that both WPA/r and Impact correlate better to round wins. Same goes for multikills, KDR, (K-D)/r, yet both of the stats we have that treat these two situations completely differently correlate better with round wins.
And so really we should just use both. They measure different things anyways, and using both tells us a lot more about the context of a team than just using one or the other. For instance, take M80 who struggled last season where it’s a question about who their best player was.
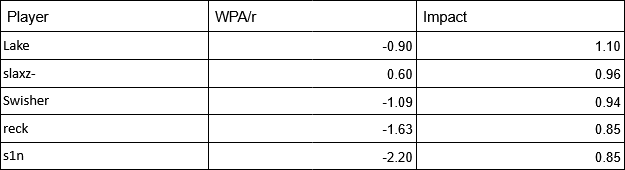
If you just look at WPA/r per round, slaxz is the only positive player on their team and Lake looks very similar to his teammates. However, if you look at their Impact stats, Lake is the only one above average player and everyone else is below average. This is to say that while slaxz has the highest net WPA, Impact says that Lake added the highest percentage of round wins on average.
And so this goes back to what was said when looking at the correlation of these stats in my last post. The difference in these stats isn’t super huge when you look at it on a team scale, but each of these stats assigns the value within a team in a different way. That’s why using just one doesn’t tell the full story.
To illustrate that, here’s a chart looking at WPA/r vs Impact for the first season among those with a minimum of 1000 rounds played:
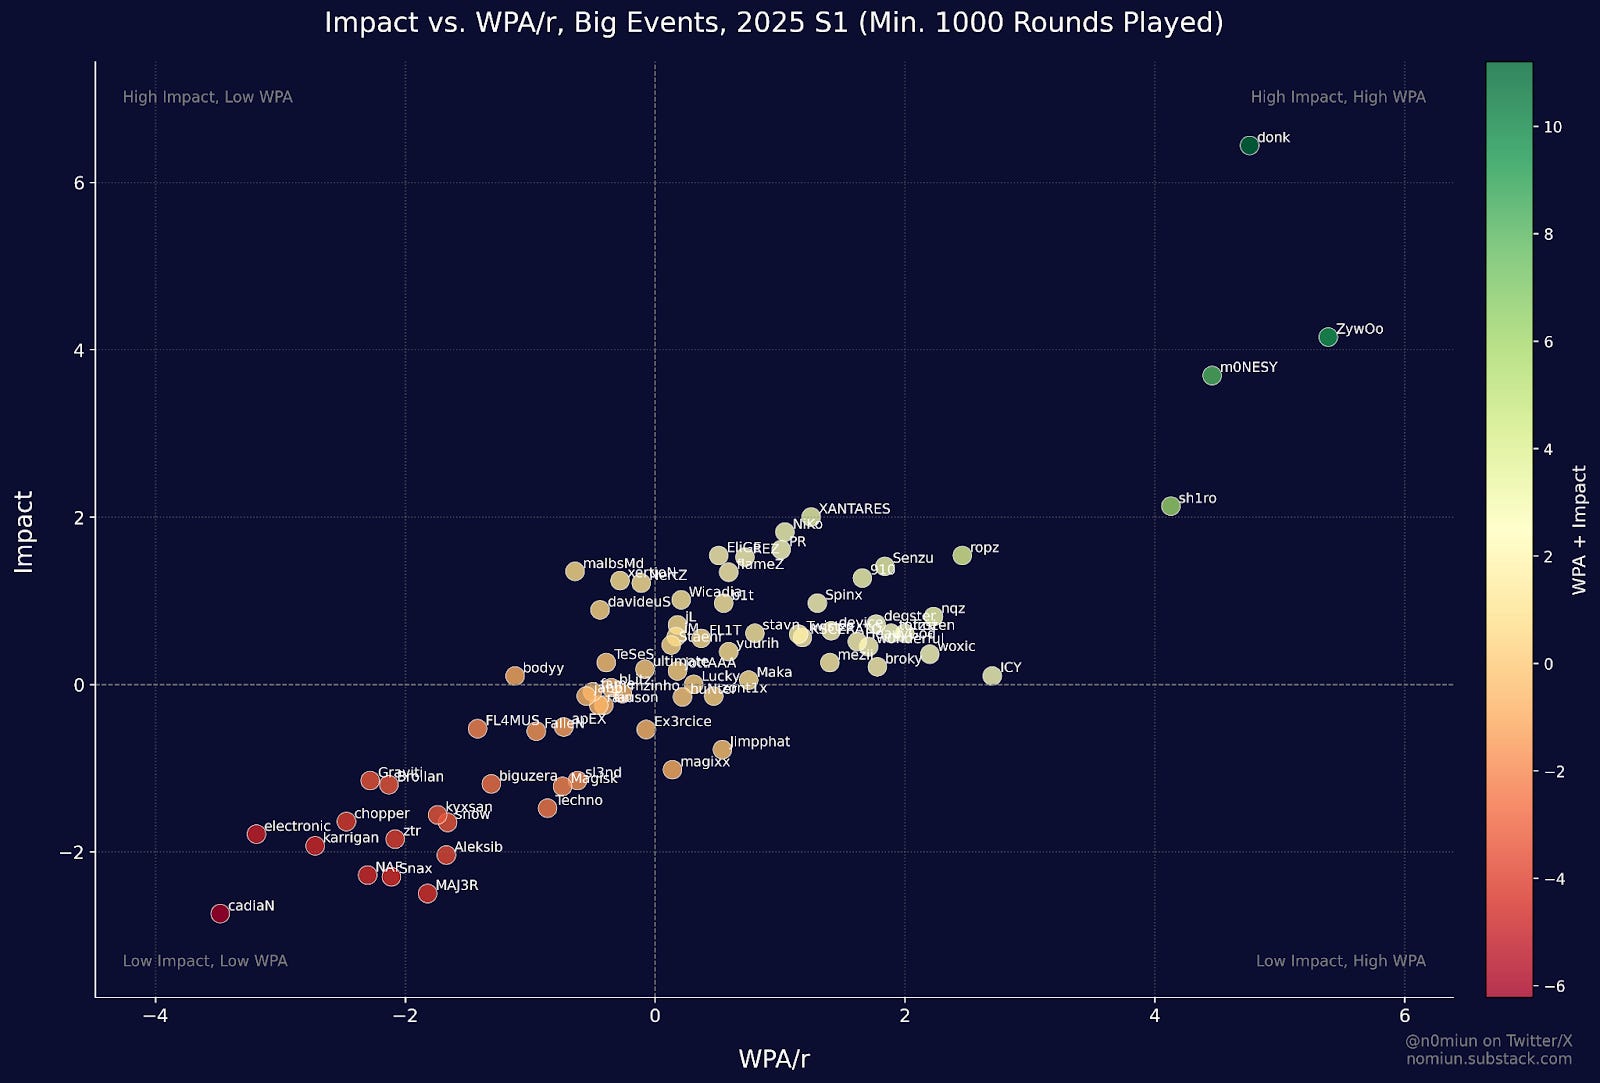
There goes donk again. The scale might be a little confusing for Impact, but the scale is basically looking at how much more “raw” impact each player has than the average player, so donk was adding 6.44 more “impact” than what the average player adds every round, that’s why he’s above 6.
It’s the same as the Impact “rating” but just expressed in a different way. And speaking of “ratings”, we have one last point we need to cover. One of my readers posted my WPA/r on HLTV, and I feel like I need to clarify something about WPA/r.
WPA/r isn’t a “rating”, it’s a stat. What do I mean by that? Well, in my eyes, there’s a key difference between a rating and a stat. A stat is a measurement, when we look at WPA/r, we’re specifically looking at how much a win probability a player gains or loses per round based on their kills and deaths. It’s the same reason this Impact stat isn’t a rating, we’re specifically measuring how much percentage of a round “win” a player is adding per round.
A rating on the other hand, takes a ton of different stats and weighs them a certain way to try and give some definitive “answer” as to which object should be rated higher. HLTV Rating 2.1 for example takes in stats including kills, deaths, trading, damage, assists, etc.
All that’s to say that if a player has a higher WPA/r than another player, that’s not saying that player is definitively rated higher or is better than another, it’s just saying that player gains more net win probability per round. These numbers on their own aren’t answers, they are just a piece of the puzzle to determining player value. How you value these stats is completely subjective.
So make sure when you’re using these numbers, that you’re using them properly. I won’t say this is entirely the fault of the user, I’ve probably not done myself any favors in the way I write, but I should clarify that as of right now I don’t plan to be in the business of making any sort of rating. I’m only going to be working with and creating stats.
Having said that, I appreciate all the new people that have subscribed to the Substack and followed on Twitter. I’ve seen quite a bit of growth recently and it helps motivate me to keep doing what I’m doing. I also appreciate all the people who ask questions and disagree with me, because then it leads to ideas like this which probably wouldn’t exist if everybody just took my stats at face value.
Until next time, thank you for reading and I hope you have a good day.
what is the R^2 of HLTV's IMPACT?
Because I have always considered it as a weird thing (it does not reward undeserving players, but it does punish deserving players to an extent)
And yes I am aware that aWPA/r is a stat not a rating, and I am very sure I referred to it as a stat everywhere I mentioned it.
As I understand it, rating is a derived value from all the "raw" stats we have. The purpose of rating is to save time, you can not watch all the games, you cannot watch all the POVs and you cannot remember everything that happens in a game, this number gives the general "quality" of performance of a player from a single glance. But to make any drastic conclusions, of course you have to do a deeper dive, you compare some more specific stats, you have to bring in where the stats come from (what type of roles or positions the player plays), against who do you get these stats (top30 opposition or top10 opposition), and where do you get these stats (in an online match or in an arena playoff).
No rating will ever truly account for all of this. Maybe in the future when our overlords at the HLTV headquarters implement a ML based ratings.